Mapping Global Greenery With Sentinel-3 & GEE🌍🛰️
This breakthrough promises to enhance our understanding of Earth's green cover, providing critical insights into ecological balance and aiding the fight against climate change. 🌍
🌱 Unveiling a New Era in Global Vegetation Mapping
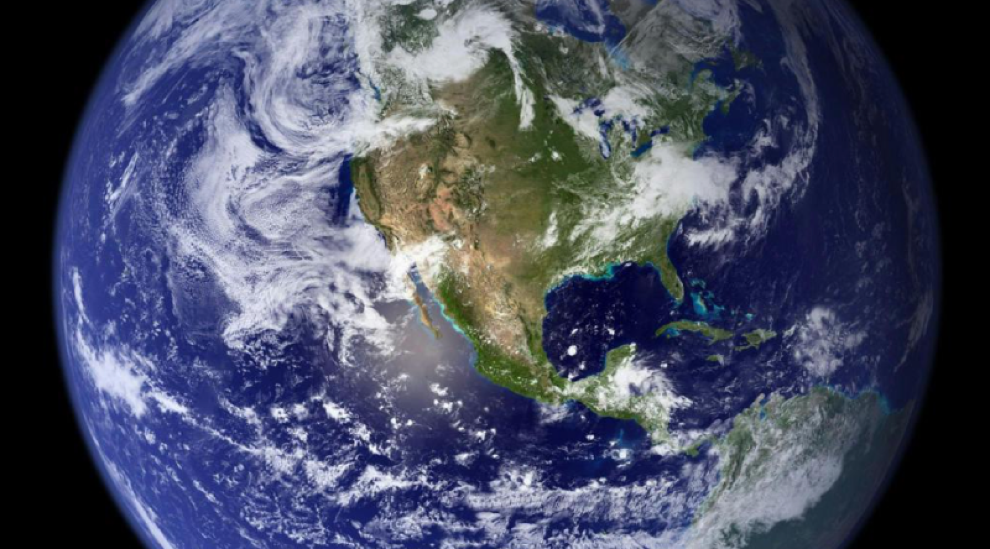
In a significant stride towards comprehensive environmental monitoring, a recent study leverages cutting-edge satellite technology and cloud-computing platforms to produce detailed, cloud-free maps of essential vegetation traits (EVTs). By utilizing data from the Sentinel-3 satellite and the powerful processing capabilities of Google Earth Engine (GEE), Kovács et al. (2024) have crafted a scalable approach to track vegetation health and dynamics on a global scale.
Why it matters: This breakthrough promises to enhance our understanding of Earth's green cover, providing critical insights into ecological balance and aiding the fight against climate change. 🌍
🔍 Understanding the Importance of Vegetation Traits
Vegetation is vital to Earth's ecosystems, acting as a crucial player in carbon sequestration and climate regulation. Key vegetation traits—such as the fraction of absorbed photosynthetically active radiation (FAPAR), leaf area index (LAI), fractional vegetation cover (FVC), and leaf chlorophyll content (LCC)—offer valuable metrics to assess the health and productivity of plant life.
Why it’s important: Monitoring these traits provides a window into the functioning and sustainability of various ecosystems, enabling timely responses to environmental changes and supporting conservation efforts. 🌿
How do you think improved vegetation monitoring could impact conservation efforts?
🛰️ Harnessing Satellite Technology and Big Data
The Sentinel-3 satellite, equipped with the Ocean and Land Color Instrument (OLCI), captures extensive data on Earth's surface. However, challenges such as cloud cover often obstruct continuous observation, creating gaps in the data.
Key takeaway: To address this, researchers employed hybrid Gaussian process regression (GPR) models and the Whittaker smoother (WS) algorithm. Integrated into GEE, these tools enable the generation of seamless, gap-free maps of EVTs at a 5 km spatial resolution, updated every 10 days. 📊
What role do you think cloud computing platforms like Google Earth Engine play in advancing environmental monitoring?
📊 A Deep Dive into the Findings
Reliable Vegetation Metrics
The EVT maps generated by this approach were rigorously compared to existing vegetation data from MODIS and the Copernicus Global Land Service (CGLS). The results were encouraging, with strong correlations observed, particularly for LAI, which showed an average Pearson correlation coefficient of 0.57 against the CGLS product.
Key insight: The highest correlations were noted in regions with distinct seasonal changes, especially between 30° and 60° latitude in the Northern Hemisphere. 🌍
Regional Insights and Implications
Four diverse regions were analyzed to assess the performance of the EVT products: the Congo Basin, Monongahela National Park in the USA, the Indo-Gangetic plains in India, and Western Australia. These areas represent different vegetation types and phenological behaviors.
Why it matters: The EVT products performed exceptionally well in regions with significant seasonal dynamics, such as deciduous forests and agricultural lands, highlighting their potential for detailed regional ecological studies. 🌱
🚀 Overcoming Data Gaps with Advanced Smoothing
The WS algorithm played a pivotal role in creating continuous data streams by filling gaps caused by cloud cover. This method proved effective in maintaining the integrity of the temporal data, ensuring that even with frequent cloud cover, the maps remain reliable and useful for ongoing monitoring efforts. ☁️
How can advanced algorithms help in tackling data challenges in environmental monitoring?
🔓 Open Source Data & Code: Promoting Collaboration and Innovation
In line with the principles of open science and data transparency, the study's methods and code are freely accessible on GitHub.
Why it’s important: This open-access approach invites collaboration and further development, encouraging the scientific community and environmental stakeholders to utilize and enhance the tools for broader applications. 🌐
Curious to explore the data and contribute? Check out the GitHub Repository: Global-EVT-maps.
📚 Author Information
Check out more insightful scholarship from the authors of this study below:
- Dávid D. Kovács
ResearchGate | LinkedIn - Pablo Reyes Muñoz
ResearchGate - Matías Salinero Delgado
ResearchGate - Jochem Verrelst
ResearchGate